CVE
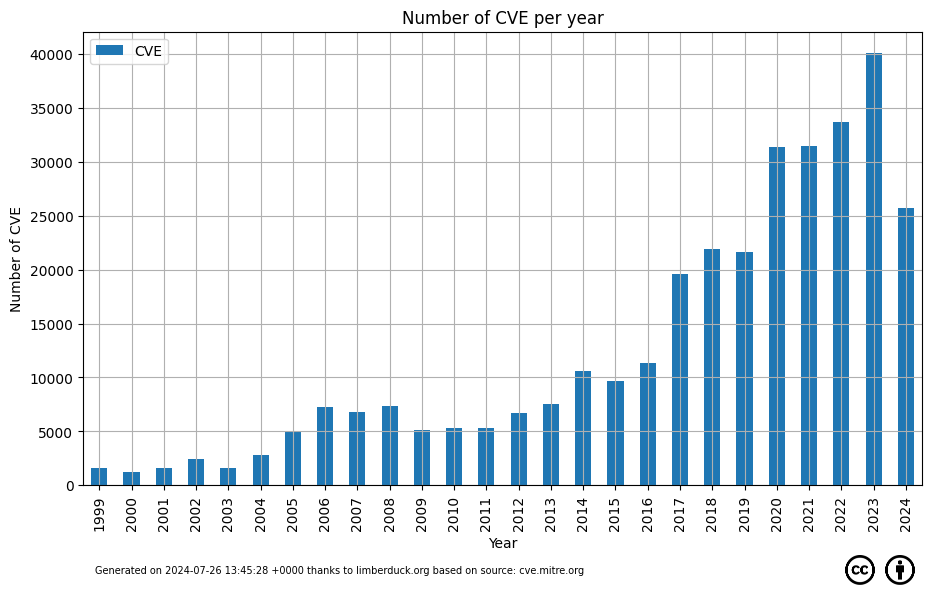
Common Vulnerabilities and Exposures Identifier (CVE ID) is a unique, alphanumeric identifier assigned by the CVE Program. Each identifier references a specific vulnerability. A CVE ID enables automation and multiple parties to discuss, share, and correlate information about a specific vulnerability, knowing they are referring to the same thing
source: www.cve.org
You can see this notebook directly via:
Generation time
from datetime import datetime, timezone, timedelta

timezone_offset = 0.0
tzinfo = timezone(timedelta(hours=timezone_offset))
generation_time = datetime.now(tzinfo).strftime('%Y-%m-%d %H:%M:%S %z')
print(generation_time)
2024-07-26 13:45:28 +0000
Creative Commons
This notebook and generated diagrams are released with Creative Commons liecense (CC BY 4.0).

import requests
import urllib3

urllib3.disable_warnings()

urls = ['https://mirrors.creativecommons.org/presskit/icons/cc.xlarge.png',
       'https://mirrors.creativecommons.org/presskit/icons/by.xlarge.png']
for url in urls:
    file_name = url.split("/")[-1:][0]
    print(file_name)

    file = requests.get(url, verify=False)
    open(file_name, 'wb').write(file.content)
cc.xlarge.png
by.xlarge.png
CVE data downloading
All CVE IDs are taken from cve.mitre.org/data/downloads/index.html
url = 'https://cve.mitre.org/data/downloads/allitems.xml.Z'
file_name = url.split("/")[-1:][0]
print(file_name)
allitems.xml.Z
import requests
import urllib3

urllib3.disable_warnings()

file = requests.get(url, verify=False)
open(file_name, 'wb').write(file.content)
74665813
import unlzw3
from pathlib import Path

uncompressed_data = unlzw3.unlzw(Path(file_name))
with open(file_name[:-2], 'wb') as file:
    file.write(uncompressed_data)
import glob

file_name = glob.glob('*.xml')[-1]
print(file_name)
allitems.xml
CVE data parsing
import pandas as pd
import xml.etree.ElementTree as et

tree = et.parse(file_name)
root = tree.getroot()
df_cols = ["number", "year"]
rows = []

for item in root:
    item_name = item.attrib.get("name")
    item_year = item_name[4:8]
    rows.append({"number": item_name, "year": item_year})

df = pd.DataFrame(rows, columns = df_cols)

print(df)
               number  year
0       CVE-1999-0001  1999
1       CVE-1999-0002  1999
2       CVE-1999-0003  1999
3       CVE-1999-0004  1999
4       CVE-1999-0005  1999
...               ...   ...
324602  CVE-2024-6320  2024
324603  CVE-2024-6321  2024
324604  CVE-2024-6322  2024
324605  CVE-2024-6323  2024
324606  CVE-2024-6324  2024

[324607 rows x 2 columns]
df = df.groupby(['year'], as_index=False)[['number']].count()
df.reset_index(drop=True, inplace=True)
df.index += 1

df.style.bar(subset=['number'], color='#FF6200')
| year | number | |
|---|---|---|
| 1 | 1999 | 1579 |
| 2 | 2000 | 1243 |
| 3 | 2001 | 1573 |
| 4 | 2002 | 2436 |
| 5 | 2003 | 1603 |
| 6 | 2004 | 2779 |
| 7 | 2005 | 4901 |
| 8 | 2006 | 7256 |
| 9 | 2007 | 6767 |
| 10 | 2008 | 7325 |
| 11 | 2009 | 5164 |
| 12 | 2010 | 5351 |
| 13 | 2011 | 5342 |
| 14 | 2012 | 6739 |
| 15 | 2013 | 7525 |
| 16 | 2014 | 10564 |
| 17 | 2015 | 9708 |
| 18 | 2016 | 11368 |
| 19 | 2017 | 19576 |
| 20 | 2018 | 21934 |
| 21 | 2019 | 21615 |
| 22 | 2020 | 31399 |
| 23 | 2021 | 31450 |
| 24 | 2022 | 33655 |
| 25 | 2023 | 40061 |
| 26 | 2024 | 25694 |
CVE data saving
CSV file is available in GitHub repository, see:
csv_filename = 'cve-number-of-entries.csv'

df.to_csv(csv_filename, index=False)
CVE data ploting
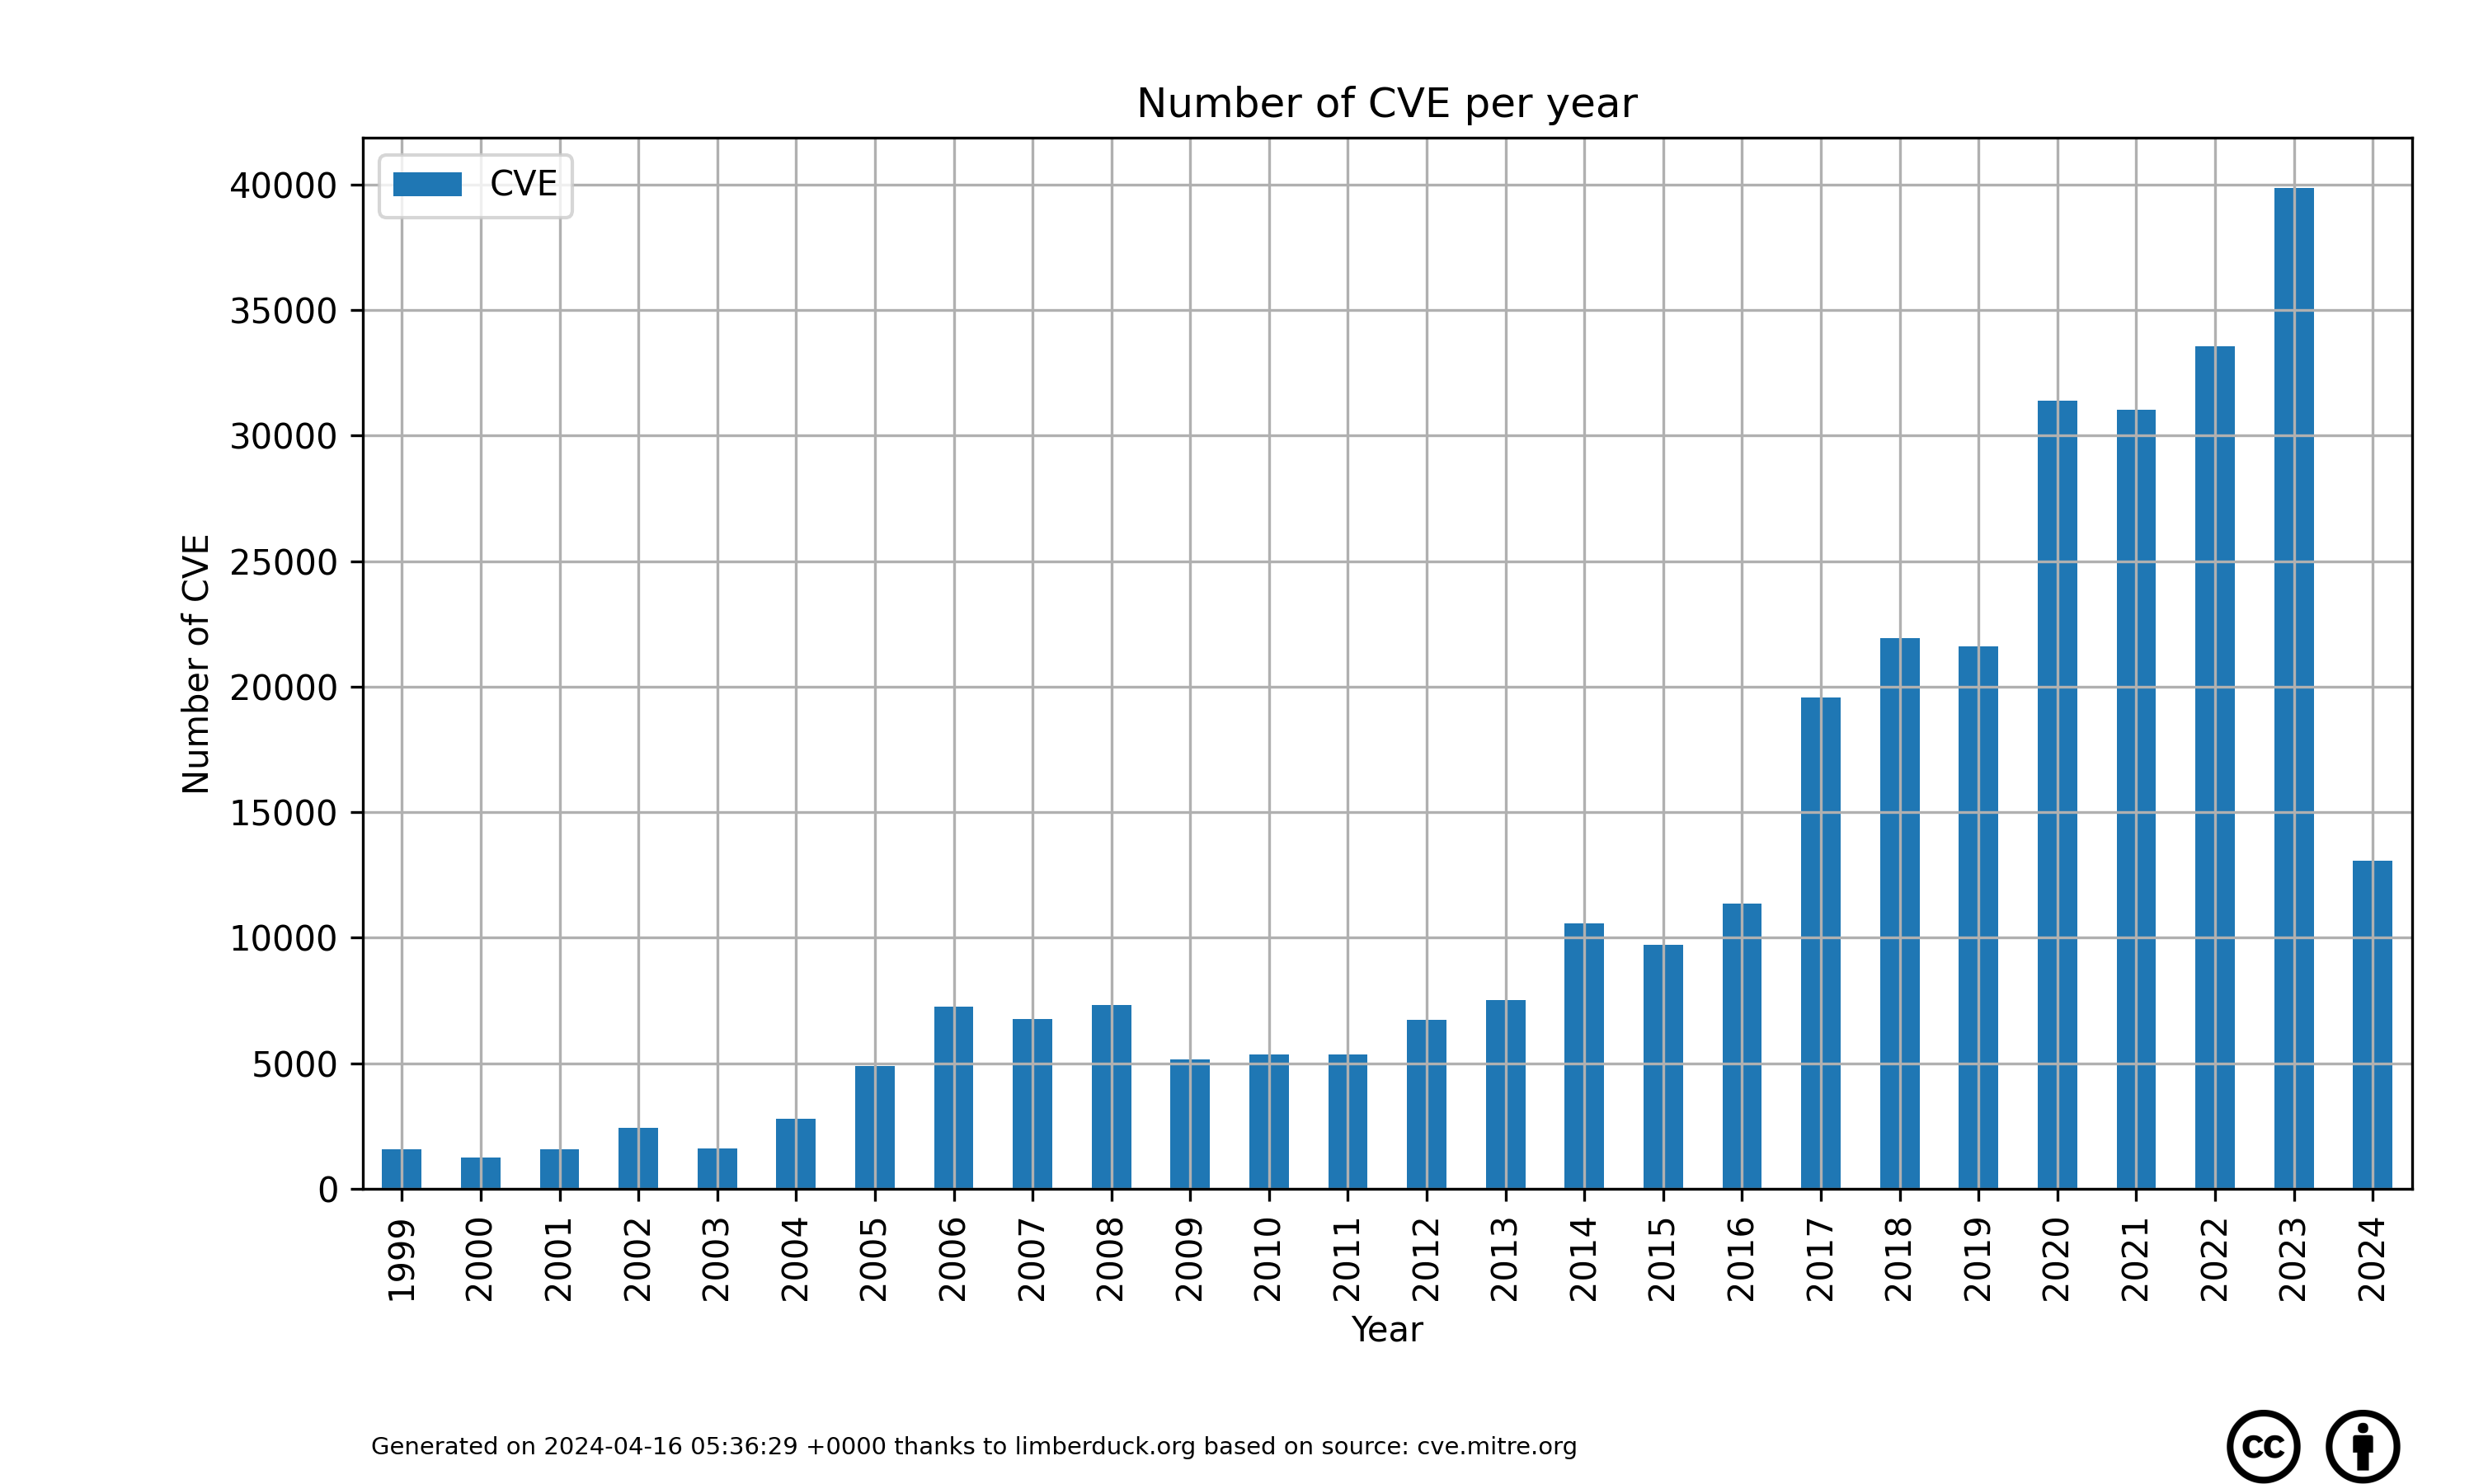
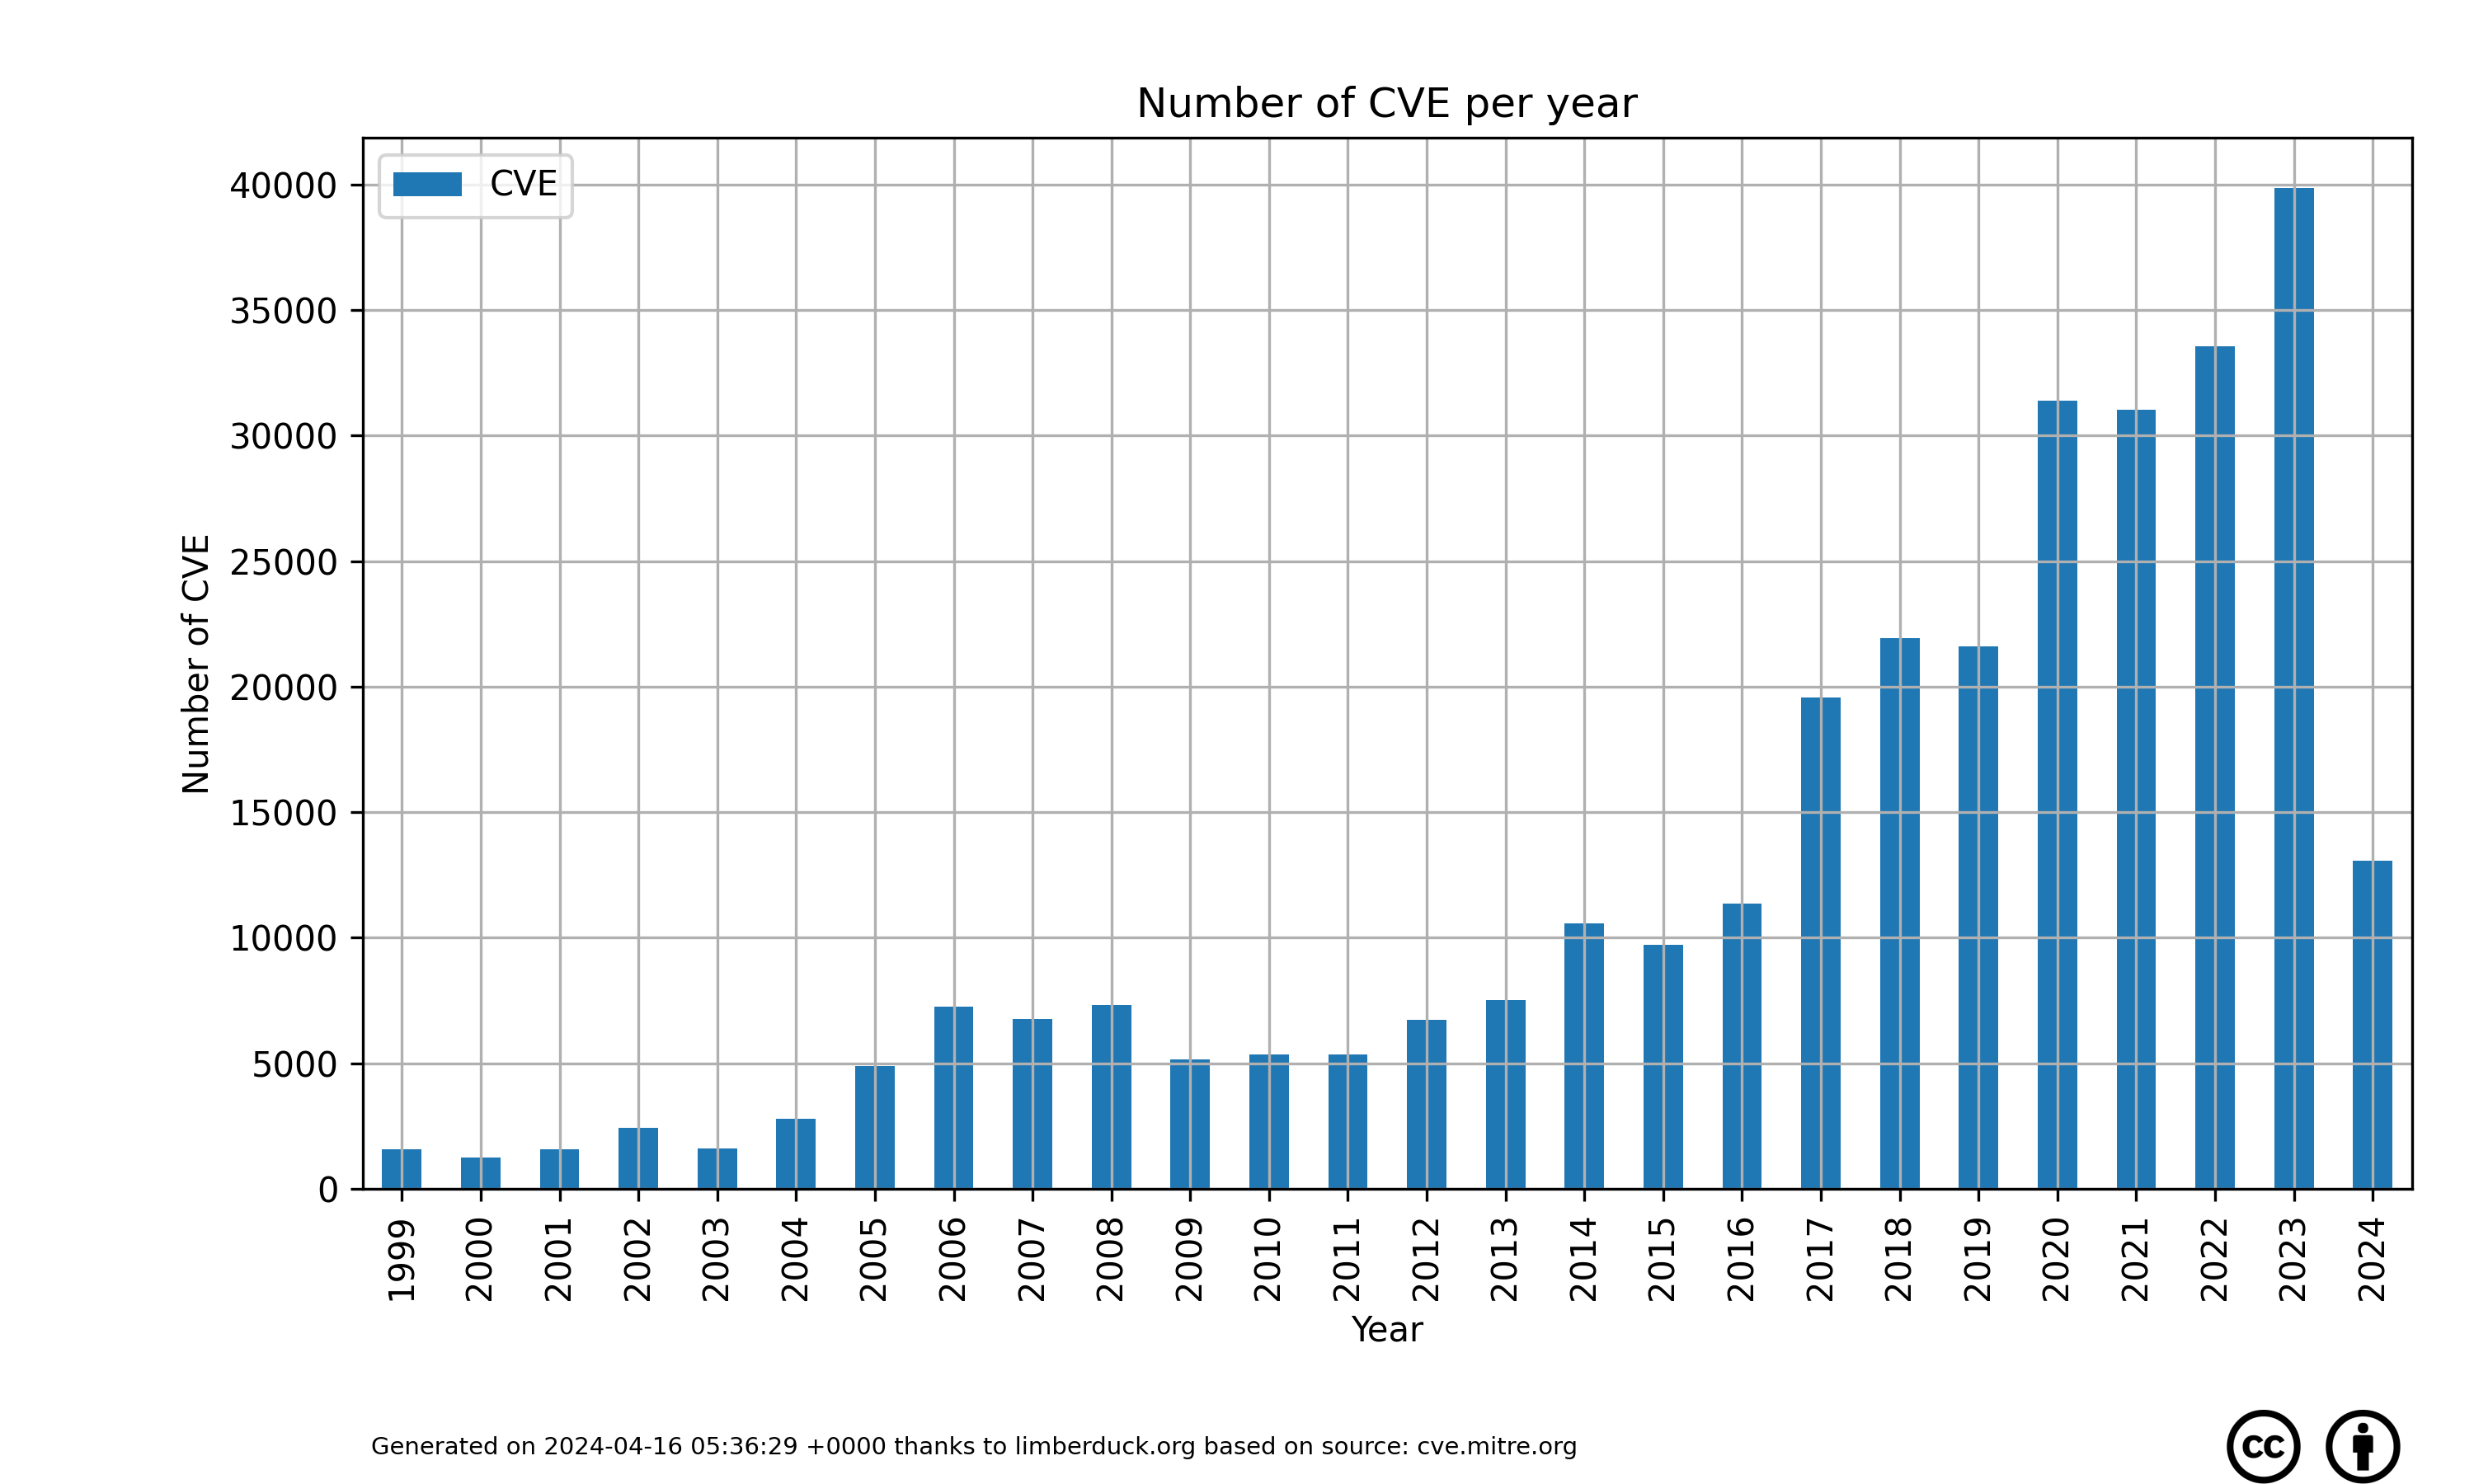
PNG files are available in GitHub repository with two background versions, see:


import pandas as pd
import matplotlib.pyplot as plt
import datetime

df = pd.read_csv(csv_filename)

df.plot(x='year',
        xlabel='Year',
        y='number',
        ylabel='Number of CVE',
        kind='bar',
        title='Number of CVE per year')
plt.tight_layout()
plt.legend(['CVE'])
plt.figtext(0.15, 0.02, f"Generated on {generation_time} thanks to limberduck.org based on source: cve.mitre.org", ha="left", fontsize=7)
fig = plt.gcf()
fig.set_size_inches(10,6)
fig.patch.set_facecolor('white')
plt.grid(True)

img_cc = plt.imread('cc.xlarge.png')
newax_cc = fig.add_axes([0.88, 0.0, 0.05, 0.05], anchor='NE', zorder=-1)
newax_cc.imshow(img_cc)
newax_cc.axis('off')
img_by = plt.imread('by.xlarge.png')
newax_by = fig.add_axes([0.92, 0.0, 0.05, 0.05], anchor='NE', zorder=-1)
newax_by.imshow(img_by)
newax_by.axis('off')

plt.savefig('cve-number-of-entries-bg-white.png', dpi = 300, facecolor = 'white')
plt.savefig('cve-number-of-entries-bg-transparent.png', dpi = 300, transparent = True)